

Diagram-as-Code: 6 Tools to Turn Code into Diagrams for Teams
Discover Diagram-as-Code (DAC) and how 6 tools help teams create version-controlled, easy-to-update diagrams. Learn how DAC improves collaboration and scalability.

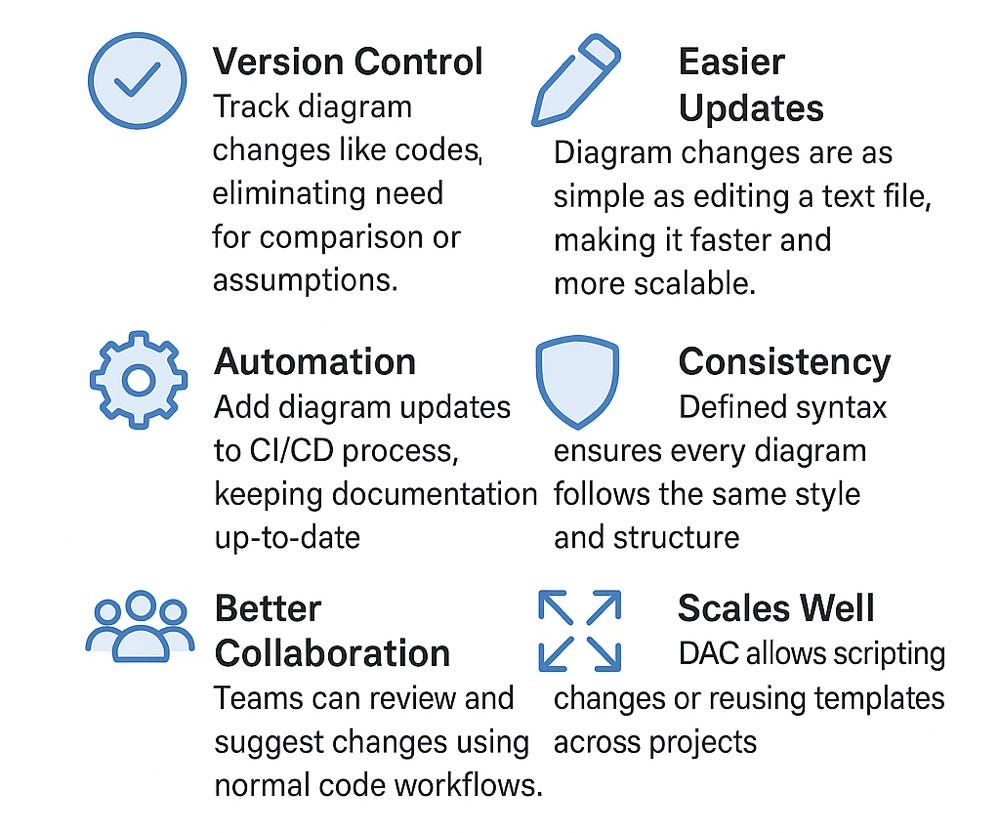
Instead of creating visual diagrams by hand, teams write code that defines the diagram. This method keeps diagrams version-controlled, easy to update, and in sync with the code they describe. It works well in fast-changing systems where clear, accurate documentation matters.
This post explains the Diagram-as-Code (DAC) method and shows how to use it. We’ll look at six popular tools that turn text into diagrams. Each tool supports different languages and types of diagrams—from cloud setups to UML. We’ll also share a few other options, give a real-world example, and offer tips for teams using DAC.
Why Diagram-as-Code Matters
Traditional diagrams are often drawn by hand and saved as separate files. The code does not alter them, nor does version control track them. That means updates are manual, slow, and easy to forget. As systems grow and change, these diagrams quickly become outdated—or get dropped altogether.
This gap causes confusion and slows teams down. To fix it, diagrams need to live in the same workflow as the code. Diagram-as-Code does that. It treats diagrams like source files: easy to update, review, and share. Such an approach makes them accurate, reliable, and part of the development process—not an afterthought.
Understanding Diagram-as-Code
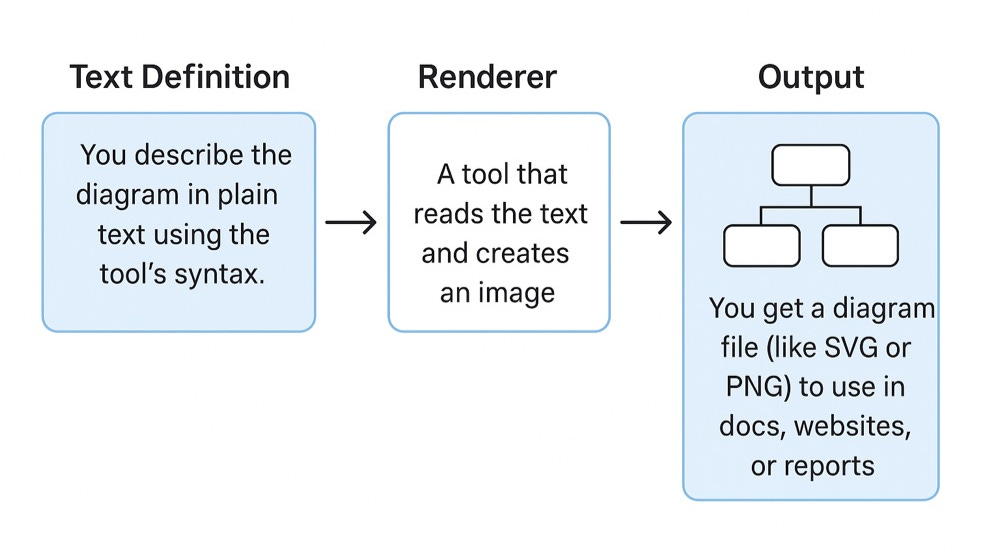
Diagram-as-Code (DAC) changes how teams create and update technical diagrams. Instead of using drag-and-drop tools, we write diagrams in plain text. Each tool uses a specific syntax or format, but the idea is the same: describe the diagram in code.
The Core Idea
DAC treats diagrams like source code. You save the text in version control systems like Git. This feature means you can track changes, review updates, and connect diagram updates to your build or documentation process. Most DAC tools use a declarative style—you write what you want to see, and a rendering tool turns it into an image like an SVG or PNG.
Since the same text always produces the same result, diagrams stay consistent across versions and teams.
Some tools also show live previews, so you can see the diagram change as you edit the text.
Top Tools for Diagram-as-Code
Several tools stand out in the Diagram-as-Code space. They’re popular, well-supported, and each fits different use cases and tech stacks. Some focus on cloud architecture. Some tools are better suited for UML or general-purpose diagrams.
In this sections, we’ll take a closer look at six of the top tools, compare their features, and help you choose the right one for your team.
1. Diagrams (Python)
Diagrams is a Python library for creating cloud system architecture diagrams, allowing users to write them in Python code, ensuring they are closely related to their code.
Key Features
Cloud Support: Works with AWS, Azure, GCP, Kubernetes, and more.
On-Prem & SaaS: Supports on-prem systems, SaaS tools, and common frameworks.
Icon Library: Comes with many built-in icons for services and tools.
Python-Friendly: Uses simple Python syntax to connect components.
If your team already uses Python, this tool fits right in. It’s fast for prototyping and great for teams that want diagrams to live in the same repo as their code.
Setup and usage Instructions
Step 1: Install Python (if not already installed) → Make sure you’re using Python 3.6 or newer.
Step 2: Install diagram
pip install diagramsStep 3: To render diagrams, you must have Graphviz installed.
# macOS
> brew install graphviz

# Windows
> Download the installer from: https://graphviz.org/download/
Example: Cloud-Native App Deployment on Kubernetes (GKE)
# filename: cloud_native_app.py

from diagrams import Diagram, Cluster
from diagrams.gcp.compute import GKE
from diagrams.gcp.network import LoadBalancing
from diagrams.gcp.devtools import ContainerRegistry
from diagrams.onprem.client import Users
from diagrams.programming.language import Nodejs
from diagrams.onprem.database import PostgreSQL

with Diagram("Cloud-Native App Deployment", show=True):

    users = Users("Users")

    with Cluster("Google Cloud"):
        lb = LoadBalancing("HTTPS Load Balancer")
        gke = GKE("Kubernetes Engine")
        registry = ContainerRegistry("Container Registry")

        with Cluster("K8s Pods"):
            frontend = Nodejs("Frontend")
            backend = Nodejs("Backend API")

        db = PostgreSQL("Managed PostgreSQL")

        users >> lb >> frontend
        frontend >> backend
        backend >> db
        backend >> registry
Step 4: To run
> python cloud_native_app.py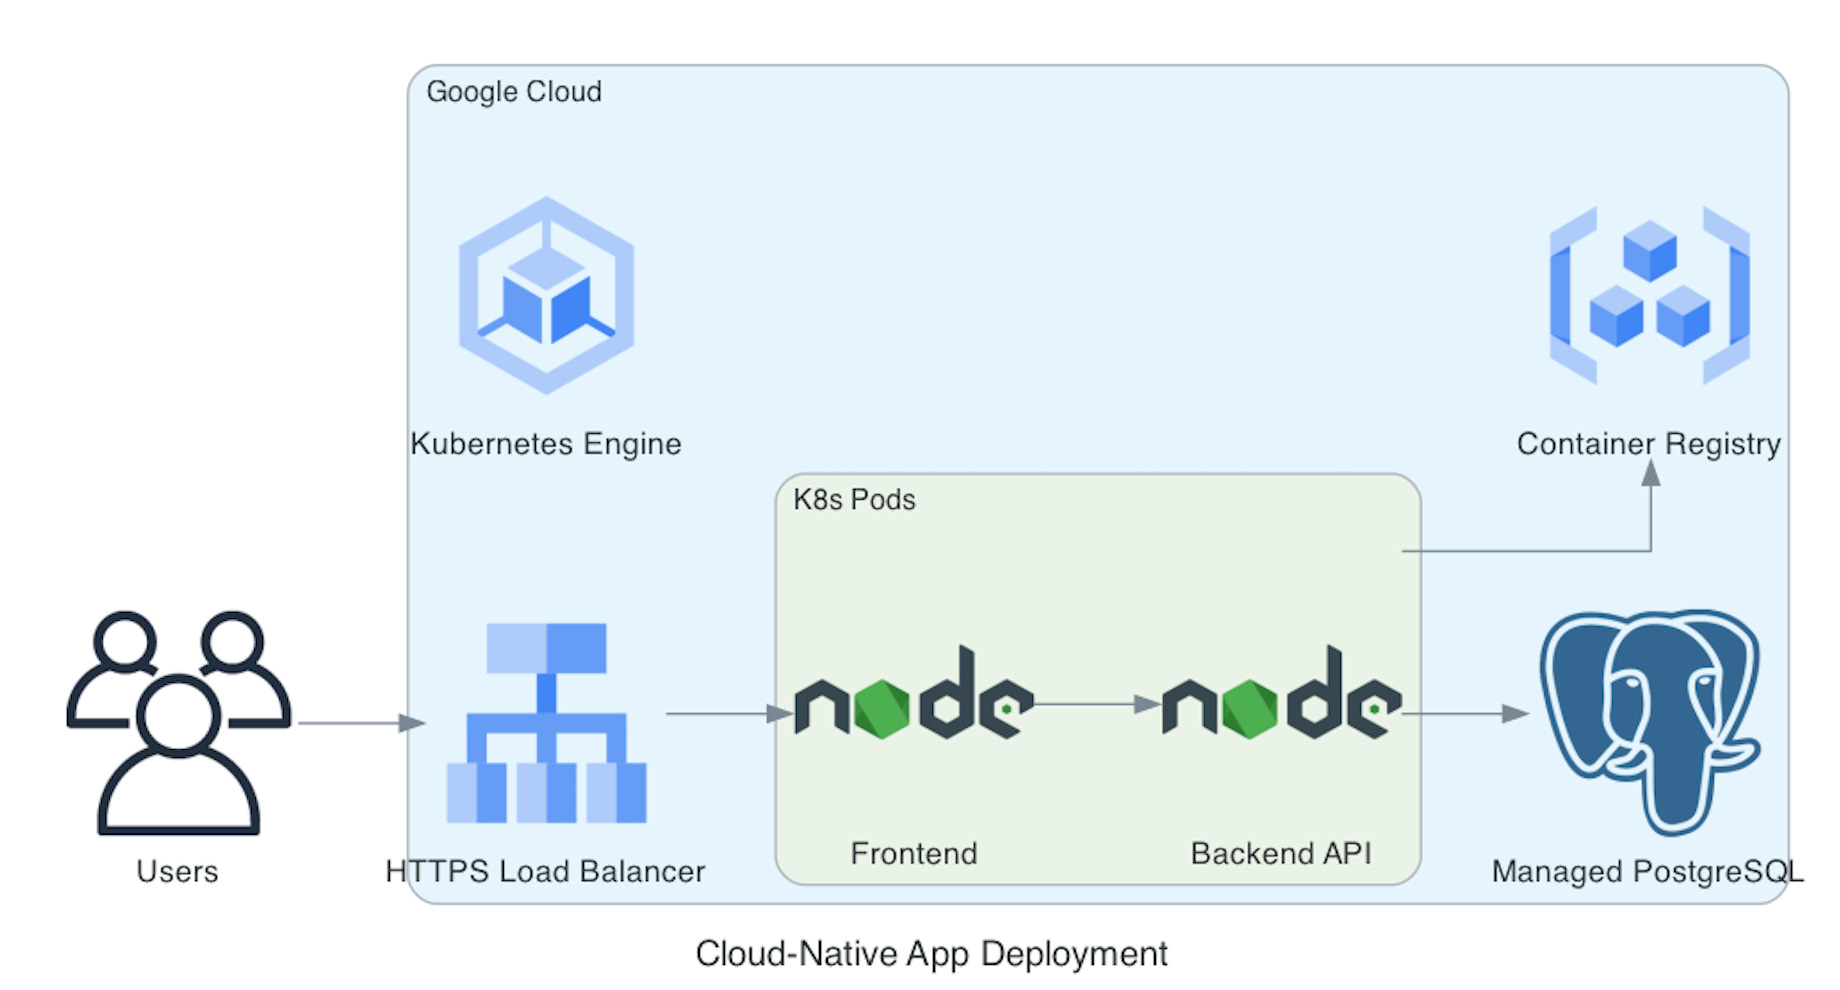
What This Diagram Shows
Users access the app via a HTTPS Load Balancer.
The app runs on GKE (Google Kubernetes Engine).
It has a frontend and backend API, each running in its own pod.
The backend connects to a managed PostgreSQL database.
Container images are stored in Google Container Registry.
3. Go-Diagrams (Go)
Go-Diagrams brings the same idea as the Python Diagrams library to Go developers. It lets you build architecture diagrams using Go code, following the same Diagram-as-Code approach.
Key Features
Go Native: Write diagrams in Go, using familiar syntax and structure.
Same Core Idea: Like the Python version, you define components and their connections in code.
Version Friendly: Diagrams live in your codebase, making them easy to track and update.
Good for Go Teams: Best suited for teams that build with Go and want diagrams in the same workflow.
It’s a solid option if your team works in Go and wants to keep diagrams close to the code.
Setup and usage Instructions
Step 1: Set up your Go environment (Go 1.18+ recommended).
Step 2: Create a new project folder
mkdir go-diagrams-demo
cd go-diagrams-demo
go mod init github.com/yourname/go-diagrams-demo
Step 3: Install the Go-Diagrams module
go get github.com/blushft/go-diagrams@latestNote: Go-Diagrams is inspired by the Python version but built from scratch for Go. It’s actively developed but not as feature-rich yet.
Step 4: To render diagrams, you must have Graphviz installed.
# macOS
> brew install graphviz

# Windows
> Download the installer from: https://graphviz.org/download/
Example: Cloud-Native App Deployment Diagram
package main

import (
        "log"

        "github.com/blushft/go-diagrams/diagram"
        "github.com/blushft/go-diagrams/nodes/gcp"
)

func main() {
        d, err := diagram.New(diagram.Filename("app"), diagram.Label("App"), diagram.Direction("LR"))
        if err != nil {
                log.Fatal(err)
        }

        dns := gcp.Network.Dns(diagram.NodeLabel("DNS"))
        lb := gcp.Network.LoadBalancing(diagram.NodeLabel("NLB"))
        cache := gcp.Database.Memorystore(diagram.NodeLabel("Cache"))
        db := gcp.Database.Sql(diagram.NodeLabel("Database"))

        dc := diagram.NewGroup("GCP")
        dc.NewGroup("services").
                Label("Service Layer").
                Add(
                        gcp.Compute.ComputeEngine(diagram.NodeLabel("Server 1")),
                        gcp.Compute.ComputeEngine(diagram.NodeLabel("Server 2")),
                        gcp.Compute.ComputeEngine(diagram.NodeLabel("Server 3")),
                ).
                ConnectAllFrom(lb.ID(), diagram.Forward()).
                ConnectAllTo(cache.ID(), diagram.Forward())

        dc.NewGroup("data").Label("Data Layer").Add(cache, db).Connect(cache, db)

        d.Connect(dns, lb, diagram.Forward()).Group(dc)

        if err := d.Render(); err != nil {
                log.Fatal(err)
        }
}
Step 4: To Run
> go run main.go
> dot dot -Tpng go-diagrams/app.dot -o app.png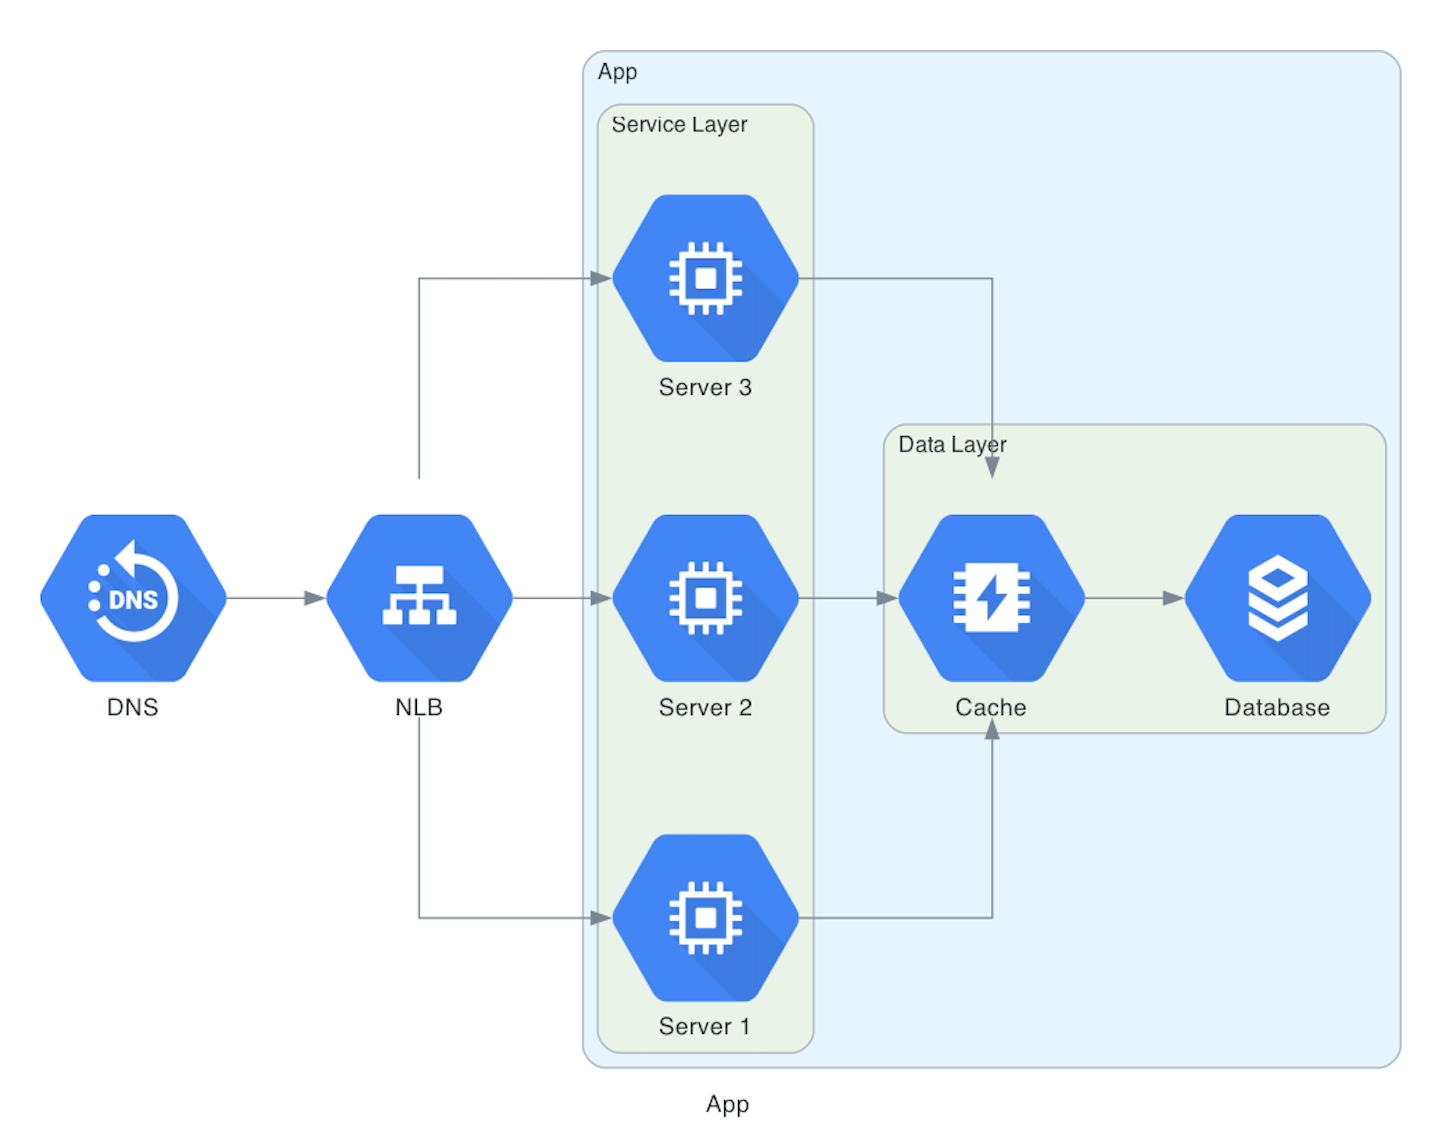
3. Mermaid (JavaScript)
Mermaid is a popular JavaScript tool that turns text into diagrams. It uses a Markdown-style syntax and is easy to add to docs, wikis, and static site generators.
What It Does Well
Mermaid helps teams keep diagrams in sync with their code. We built Mermaid to prevent "doc rot"—the issue of diagrams becoming outdated. By writing diagrams in plain text and storing them with your code, updates are quick and easy.
Key Features
Works well with Markdown and many documentation tools
Simple syntax that’s easy to learn
Supports many diagram types:
Flowcharts
Sequence diagrams
Class diagrams
State diagrams
Entity-relationship diagrams
Gantt charts
Mermaid is a strong choice for teams that want to keep diagrams close to their documentation and source code.
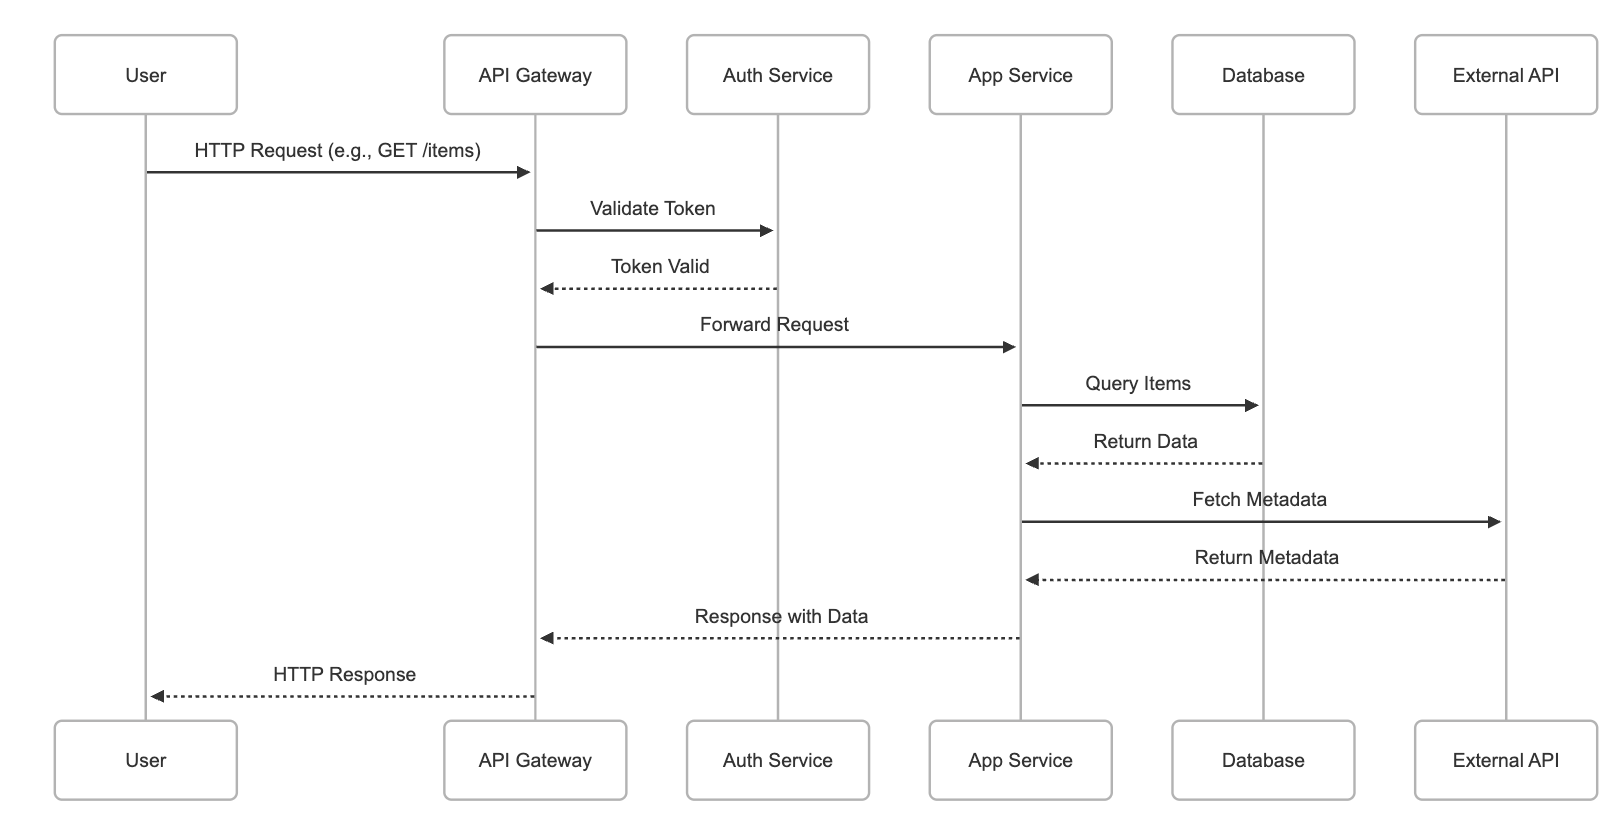
Example: Here’s a basic cloud-native application sequence diagram example using Mermaid. It shows a common pattern: a user sends a request through an API gateway to a backend service, which in turn queries a database and calls a third-party service.
sequenceDiagram
    participant User
    participant API Gateway
    participant Auth Service
    participant App Service
    participant Database
    participant External API

    User->>API Gateway: HTTP Request (e.g., GET /items)
    API Gateway->>Auth Service: Validate Token
    Auth Service-->>API Gateway: Token Valid
    API Gateway->>App Service: Forward Request
    App Service->>Database: Query Items
    Database-->>App Service: Return Data
    App Service->>External API: Fetch Metadata
    External API-->>App Service: Return Metadata
    App Service-->>API Gateway: Response with Data
    API Gateway-->>User: HTTP Response
You can paste this into Mermaid live editor (like Mermaid Live Editor) or embed it into tools that support Mermaid (e.g., Markdown files in GitHub, Obsidian, or Docusaurus).
4. PlantUML
PlantUML is a widely-used Diagram-as-Code tool, renowned for creating UML diagrams in text format and serving as a rendering engine for other languages like Structurizr DSL.
Key Features
Supports many diagram types: sequence, use case, class, activity, component, deployment, and state machine diagrams.
It works well for software design and architecture.
The system can render C4 model diagrams using Structurizr DSL.
Integrates with many tools: documentation platforms, wikis, issue trackers, and IDEs.
PlantUML is a solid choice if you need full UML support or want tight integration with your existing dev tools.
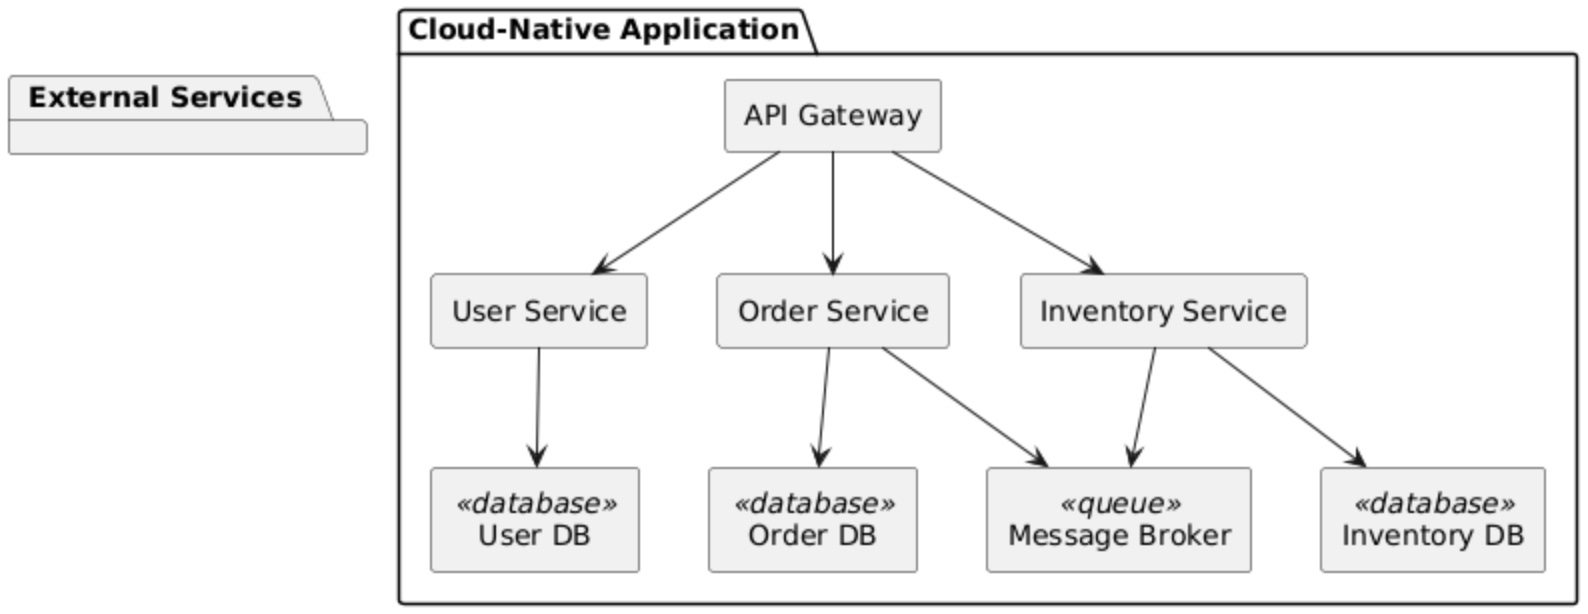
Example: Here’s a basic PlantUML example to generate a UML component diagram for a cloud-native application. This sketch shows common components like an API Gateway, microservices, and external dependencies like a database and message broker.
You can paste this into PlantUML Live Editor or embed it into IDE plugins (e.g., for IntelliJ, VSCode) that support PlantUML.
5. ASCII Diagrams (Using Tools Like Ditaa)
ASCII diagrams use plain text characters—like +, -, |, and /—to draw simple visuals. Tools like Ditaa (Diagrams Through ASCII Art) can turn these diagrams into clean images.
What It Does
Ditaa reads ASCII layouts and converts them into bitmap or vector graphics. It spots shapes and lines based on how characters are arranged in the text.
Where It Fits
Good for quick, simple diagrams
Easy to write and edit with any text editor.
Works well with tools like Asciidoctor, making it easy to add diagrams into your docs.
Helps convert old, hand-made text diagrams into clean images.
Limitations
It’s less powerful than tools like PlantUML or Mermaid. However, it is effective for small tasks or teams that prefer to work in plain text.
Setup and usage Instructions
Step 1: Java (JRE or JDK) is required. Ditaa is a Java program.
java -versionStep 2: Get the .jar file from the official repository: https://github.com/stathissideris/ditaa/releases
Save it somewhere, e.g., ~/tools/ditaa/ditaa.jarStep 3: To render diagrams, you must have Graphviz installed.
# macOS
> brew install graphviz

# Windows
> Download the installer from: https://graphviz.org/download/
Example: Let’s take a cloud-native web app made of three key services:
Frontend (a React app)
Backend API (Node.js/Express)
Database (PostgreSQL)
The services run in containers managed by Kubernetes, and everything is behind a load balancer. You want a simple overview diagram showing how these parts connect.
+-------------------+
|  Load Balancer    |
+--------+----------+
         |
         v
+--------+----------+
|    Frontend       |
| (React + NGINX)   |
+--------+----------+
         |
         v
+--------+----------+
|   Backend API     |
| (Node.js/Express) |
+--------+----------+
         |
         v
+--------+----------+
|   Database        |
|   (PostgreSQL)    |
+-------------------+
Step 4: To Run
> java -jar ~/tools/ditaa/ditaa.jar app.txt app.png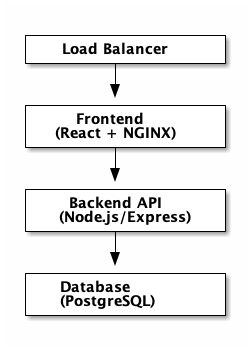
6. Markmap
Markmap turns Markdown files into interactive mind maps. It reads headings and nested lists, then creates a visual map that mirrors the document’s structure. While it’s not designed for system architecture, it still fits the Diagram-as-Code model by converting text into visuals.
What It’s Good For
Markmap is best for:
Visualizing outlines
Mapping ideas from brainstorming sessions
Showing nested concepts in Markdown documents
It’s a lightweight way to turn notes into clear, interactive maps. Though not built for software diagrams, it shows how text-based formats can support many types of visual thinking.
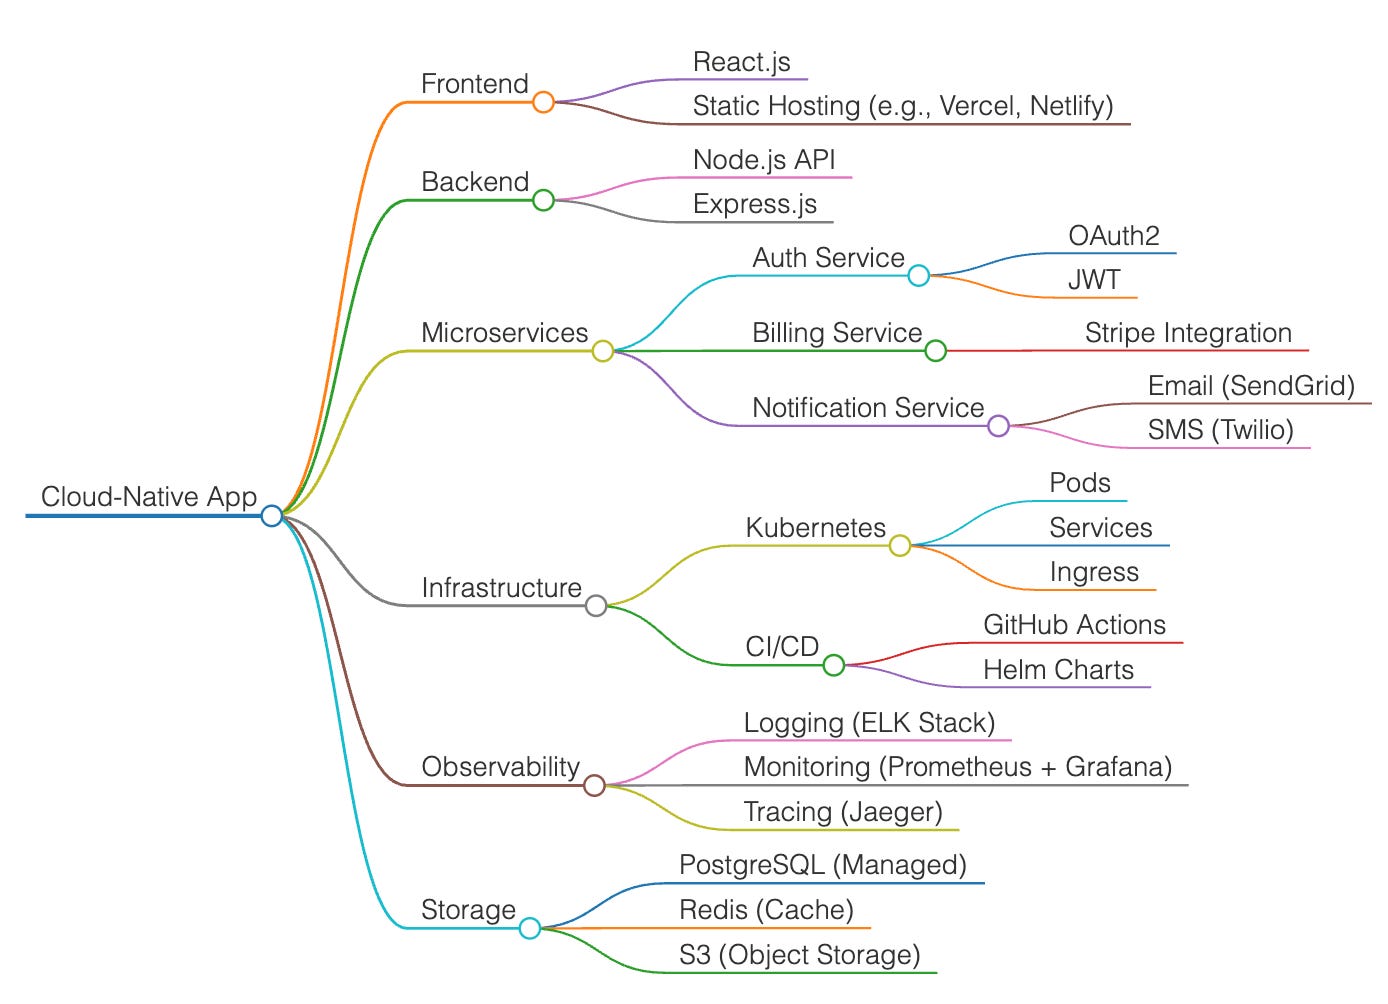
Example: Here’s a simple example of how you might visualize a cloud-native app using Markmap. The idea is to show the architecture or concept map in outline form using Markdown—Markmap will then render it as a mind map.
# Cloud-Native App

## Frontend
- React.js
- Static Hosting (e.g., Vercel, Netlify)

## Backend
- Node.js API
- Express.js

## Microservices
- Auth Service
  - OAuth2
  - JWT
- Billing Service
  - Stripe Integration
- Notification Service
  - Email (SendGrid)
  - SMS (Twilio)

## Infrastructure
- Kubernetes
  - Pods
  - Services
  - Ingress
- CI/CD
  - GitHub Actions
  - Helm Charts

## Observability
- Logging (ELK Stack)
- Monitoring (Prometheus + Grafana)
- Tracing (Jaeger)

## Storage
- PostgreSQL (Managed)
- Redis (Cache)
- S3 (Object Storage)
What This Gives You
When rendered in Markmap, this will turn into a collapsible mind map showing the different parts of your cloud-native app—organized clearly by layers or services. It’s ideal for giving a high-level overview to stakeholders or as a quick reference for engineers.
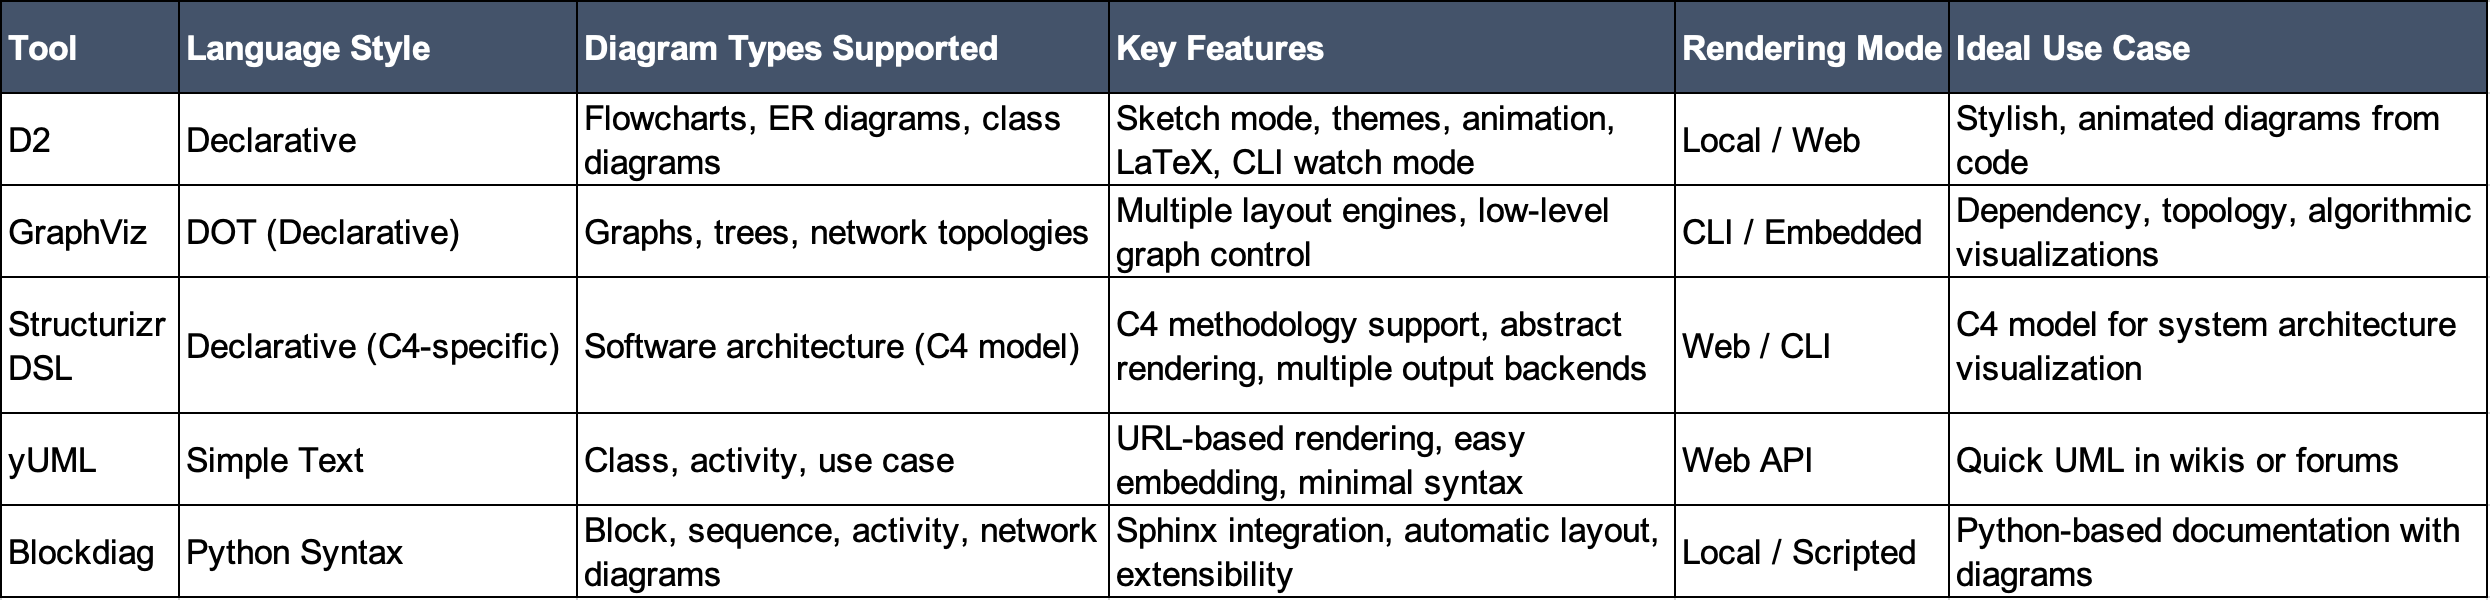
Other Notable Diagram-as-Code Tools
The Diagram-as-Code space has grown fast. While PlantUML is a heavyweight, several other tools bring unique strengths.
Implementation and Results
The plan was to define architecture diagrams for each Microservices and key interactions using Mermaid in the service README files. Infrastructure diagrams were created using Diagrams and stored in a separate documentation repo. Both were added to the CI pipeline. A pre-commit hook and a CI job automatically rendered the text-based definitions into SVGs, embedding them into the documentation site with every code update.
Results:
Reduced Documentation Issues: Diagrams updated automatically when the code or infrastructure changed, keeping everything accurate.
Better Collaboration: Developers could update diagrams via pull requests, making them more involved in the documentation process.
Faster Onboarding: New engineers had up-to-date diagrams, cutting down the time it took to learn the system.
Quicker Incident Response: Engineers had accurate diagrams to refer to during production issues, helping to resolve problems faster.
While learning the tools took some time, the long-term benefits—less manual work and more reliable docs—were well worth the effort. This case shows how using DAC tools in the workflow turns diagrams into valuable, always-accurate resources.
Why DAC Matters More Than Ever
With today’s distributed systems, microservices, and rapid changes, keeping documentation up to date is a huge challenge. Manual methods can’t keep up. Diagram-as-Code solves such an issue by integrating diagram creation directly into the development workflow. It turns diagrams into living, version-controlled assets that update automatically as the code changes.
For teams building complex software, DAC isn’t just nice to have—it’s essential. It ensures clarity, improves collaboration, and helps maintain and evolve systems more efficiently.
Actionable Recommendations
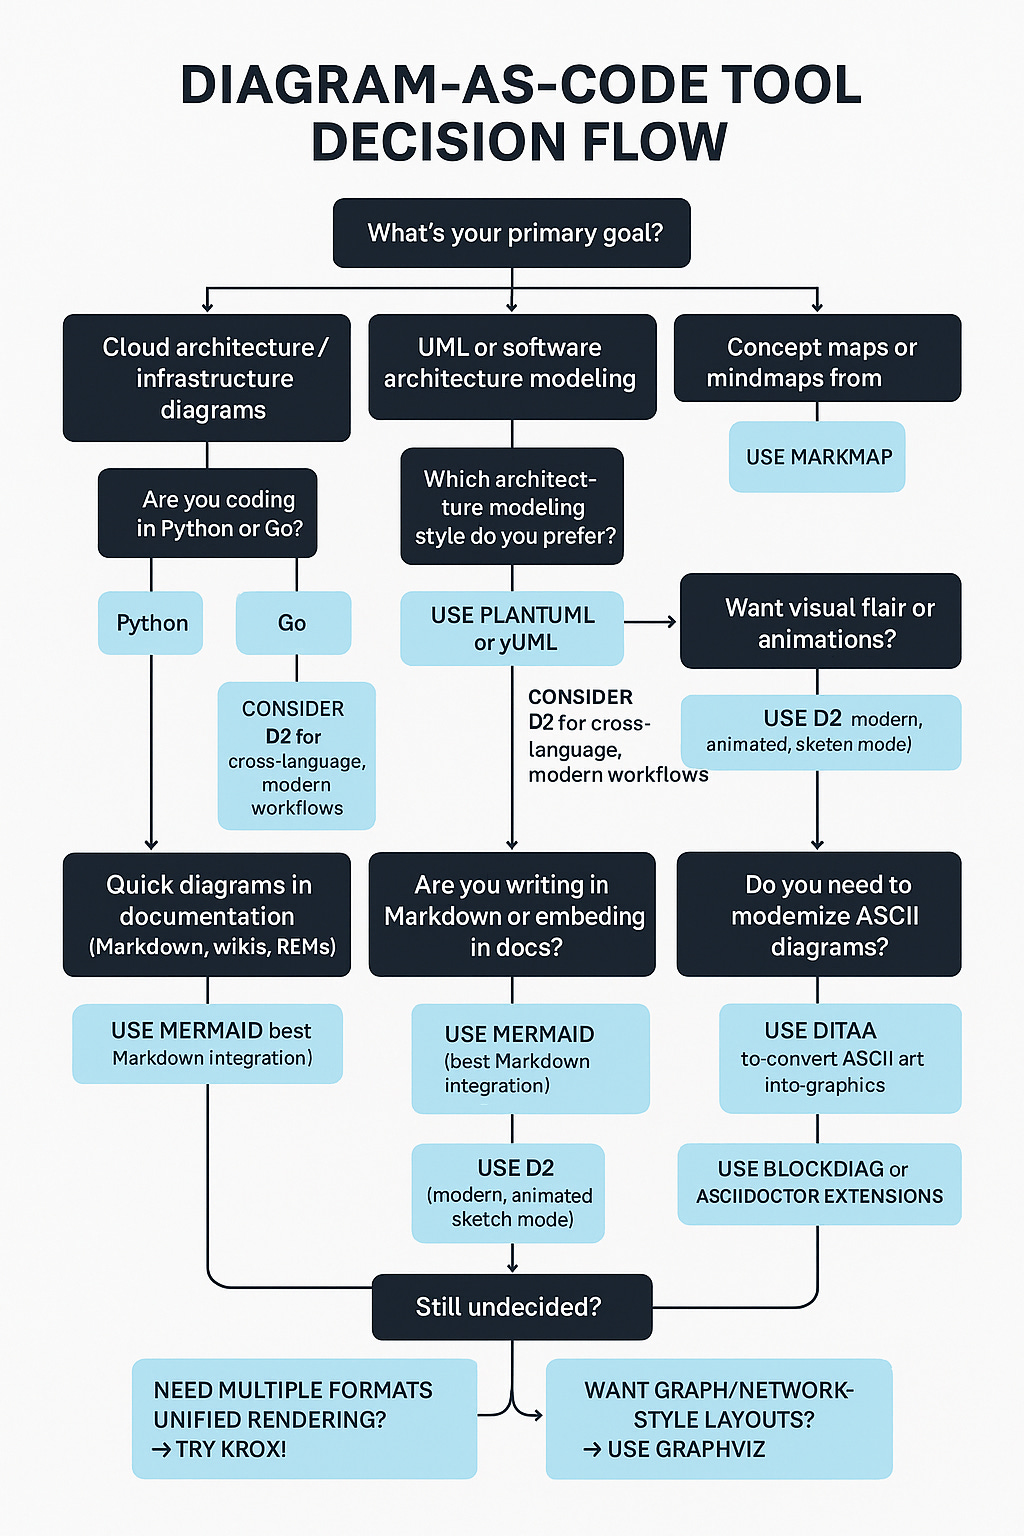
How to Choose the Right Tool
Match the Tool to the Task: Use Diagrams or Go-Diagrams for cloud setups. Try PlantUML or Structurizr DSL for software architecture. Go with Mermaid or yUML for quick diagrams. Use Markmap for mind maps or ASCII/Ditaa for text-based visuals.
Check Language Fit: Pick tools that work with the languages your team uses. For example, use Diagrams for Python or Go-Diagrams for Go.
Look at Integration Needs: Make sure the tool works with your docs platform, wiki, and CI/CD setup. Use Kroki if you need to support several formats or want a central rendering service.
Consider Learning Curve: Mermaid and yUML are simpler. PlantUML and GraphViz are more powerful but take time to learn.
Check Output Format Support: Make sure the tool can export to formats you use—SVG is a safe choice for quality and scalability.
Tips for Getting Started
Begin with one project or a small set of diagrams.
Train your team on the tool’s syntax and workflow.
Add diagram rendering to your CI early.
Ask devs to update diagrams as part of code changes.
Review diagram files like you would source code.
Call to Action
Look at where your current documentation breaks down. Are diagrams missing, outdated, or hard to maintain? Pick one of the tools from this guide and try it in a real workflow. Start small. Integrate it into your CI. See how it fits. Diagram-as-Code isn’t just a better way to draw—it’s a better way to work.
Bottom Line
Diagram-as-Code changes how teams document and understand systems. By defining diagrams in code, teams gain version control, automation, and alignment with real architecture. This guide covered six top tools—Diagrams, Go-Diagrams, Mermaid, PlantUML, Ditaa, and Markmap—plus others like D2, GraphViz, and Structurizr DSL. Each has a place, depending on your needs.
The case study showed clear gains: fewer stale diagrams, better onboarding, and faster incident response. Yes, there’s a learning curve. And yes, some tools are still maturing. But the direction is clear. DAC is no longer optional for serious software teams. It’s the new default.